Notes
The forced vibration under a harmonic force discussed in Vibration
> Forced vibration > Harmonic force, examines the response of
a MEMS device subjected to a time varying force with constant
amplitude like electrostatic force. In some other cases the device
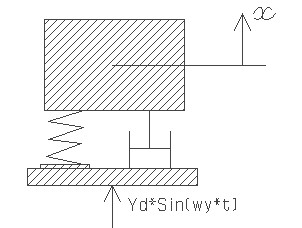
will be forced into vibration by placing it in direct contact with
another vibrating structure. For example during the calibration of
an accelerometer, the device will be mounted on top of a vibrator,
shaker table or Hopkinson bar to excite the accelerometer mass. In
this case, the base on which the MEMS device is mounted will move
with a radial frequency 'wy' and with amplitude 'Yd'. Based on the
initial conditions including displacement and velocity of the mass,
it will undergo a transient response immediately after it starts to
vibrate. But as time becomes large, it assumes a steady state
response which will be independent of the initial conditions. Only
steady state vibrations are examined here and assumes that time is
large so that transient response can be neglected.
This design interface can be used to estimate the resonance frequency, amplitude of vibration and phase lag. The resonance frequency is dependent on the natural vibration frequency and damping. When the damping is very small, the resonance frequency is nearly equal to the natural vibration frequency. The vibration amplitude is strongly dependent on damping and the excitation frequency. The vibration amplitude is highest when the base excitation frequency is near the resonance frequency and should be avoided in most cases. Unlike the harmonically force excited vibration, the amplitude frequency plot for base excitation will show a peak in amplitude even for over damped parts. Also the large drop in amplitude at high driving frequency and for over damped parts observed in the harmonically force excited vibration does not happen in this case.
The free vibration frequency is as estimated for the various structures under Vibration > Free vibration. If the damping ratio for air damping is not available it could be estimated using the design forms under Vibration > Damping for a given air gap distance.
There is a phase lag in the vibration of the system with respect to the base excitation depending on the damping ratio, the excitation frequency and natural frequency of vibration. If the amplitude of vibration is known, dividing it by the amplitude of base motion will give the relative amplitude. It is an indication if the vibration amplitude is higher or lower than the base motion amplitude.
The plot shows relative amplitude of vibration of the system for a range of driving frequency above and below the natural frequency of the system for the given damping ratio. For a given damping ratio, the maximum relative amplitude obtained from the curve is equal to the Quality factor or Q-factor of the system. This maximum amplitude happens also at the resonant frequency. Using the cross hair tool, the resonant frequency, the Q factor and the amplitude of vibration of the system can be estimated from the graph.